Difference between offline and online partial discharge monitoring
In the field of electrical equipment diagnostics, the ultimate goal is not only to detect existing issues but to accurately predict the future reliability and performance of the equipment. This is especially critical when monitoring partial discharges, which can indicate potential insulation failures in high-voltage systems.
While both offline and online partial discharge monitoring methods provide valuable insights, they differ significantly in how they gather and interpret data, each with distinct advantages and limitations. Understanding these differences is key to choosing the right approach for ensuring the long-term reliability and safety of electrical assets.
What is offline (testing) diagnostics?
We obtain diagnostic information from equipment through test methods, mainly when the device is not in operational mode. One of the key aspects of offline diagnostics is its periodicity, with sensors usually installed during testing. The major advantage of this approach is that it can be applied to any device and to any diagnostic signal that can be integrated into predictive models.
The processing and especially the evaluation of diagnostic data models are always statistical, which means the results always come with some level of uncertainty. One commonly used approach is by application of the statistical Weibull distribution. This distribution divides the product life cycle into 3 stages represented by the “bathtub curve“, which helps define the lifetime forecast of electrical equipment.
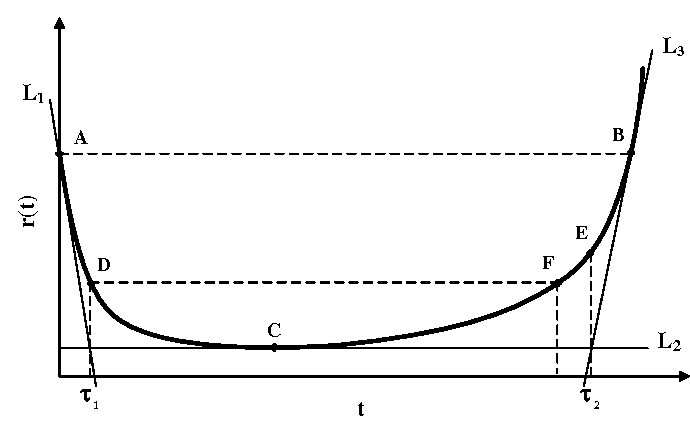
- Stage I (A-D): the period of early disturbances – in this zone there is a rapid decrease in the intensity of disturbances. The high frequency is initially caused by a flashover, in which failures due to errors in manufacturing, assembly or design of the object are manifested.
- Stage II (D-F): period of normal operation – this is a long period, also called the period of normal use. The product is used for its intended purpose with an approximately constant occurrence of failures. Failures occur mainly due to external causes, usually there is no wear affecting the properties of the object.
- Stage III (F-B): aging period – there is an increase in the intensity of failures due to material aging and wear. After exceeding the sustainable failure rate, the object is shut down and decommissioned.
Some facilities may miss the early failure period. This occurs mainly in cases where the object is inspected and tested directly by the manufacturer. The aging period may also be missing – this can happen if the facility is decommissioned before the aging increase in failure rate becomes apparent.
Offline diagnostics relies on statistical methods to estimate the predicted lifetime of equipment, as the actual lifespan cannot be directly verified. This theoretical approach is used to determine the remaining life, though it requires shortened test intervals for more accurate predictions within the residual lifetime phase.
What is online (functional) diagnostics?
During online diagnostics, the sensor is mounted directly on the equipment to gather information during its routine operation. The frequency of measurements is adjustable, which ensures accurate monitoring across all operating conditions. The main challenge lies in finding a suitable diagnostic variable that accurately reflects the equipment operating state.
The development of sensor technology and computing have expanded the spectrum of suitable diagnostic variables, such as vibrations, current spectra and partial discharges. Each of these variables provide valuable insights of the device operating state.
Along with supplementary information, such as environment conditions, we can use the detected information for both emergency diagnostics and predicting the equipment’s lifespan. The measured diagnostic quantity reflects the frequency of potential failures, allowing for more reliable forecasts based on real-time data.
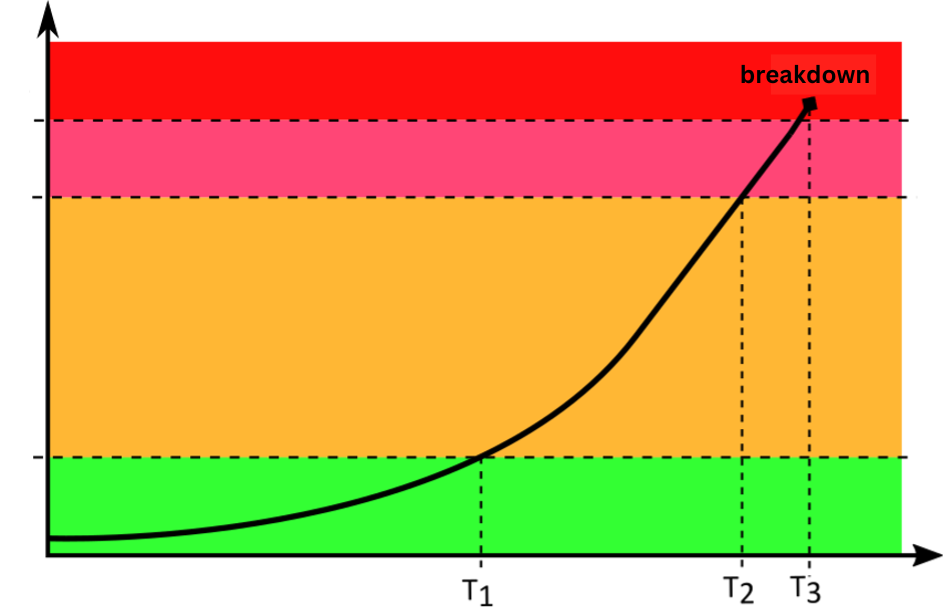
The area from zero to T1 is often referred to as the mean lifetime, a period useful for planning future maintenance resources. In the T1 to T2 area, with proper settings, there is usually sufficient time to plan and execute maintenance.
To forecast equipment behavior, a projected curve of potential failure rates needs to be created, modeling the expected failure pattern, which is usually exponential. Since online measurements provide a large continuous stream of data, various approaches can be used to generate this curve. An additional benefit is the ability to analyze and validate the model, allowing the system to improve through self-learning.
Online diagnostics is a current trend, as it enables both permanent monitoring of emergency limits and forecasts based on real information with retrospective verification.
Interpreting the results of online diagnostics
The current concept in diagnostics is system for experts. It presents customers with meaningful measurements and lets him decide on the next steps. The main monitored variable is equivalent charge, displayed on the resulting waveform.
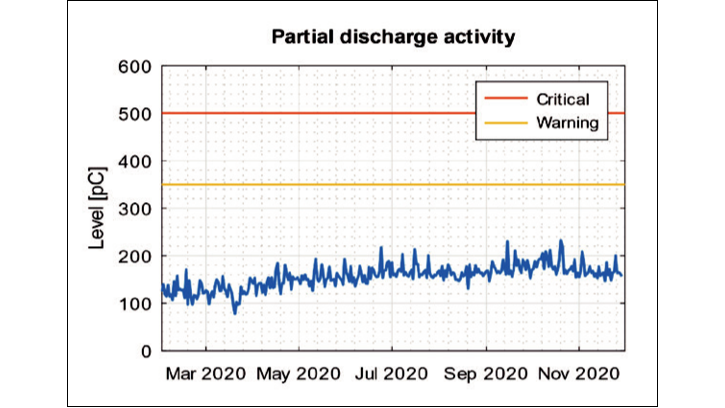
During evaluation, it is always important to pay attention to current trends. If the trend is stable or decreasing, there is less concern. However, if it increases, even small changes could become critical. In addition, environment, such as ambient temperature, atmospheric pressure and relative humidity, should also be measured, as they have influence on the trend of the increase of the equivalent charge.
Conclusion
Both offline and online diagnostics play essential roles in monitoring and predicting the reliability of electrical equipment.
Offline diagnostics, with its broad applicability and flexibility, allows for detailed analysis during non-operational periods and is ideal for building predictive models. However, it requires shorter testing intervals to enhance accuracy.
On the other hand, online diagnostics continuously monitors equipment in real-time, providing a steady flow of data that can be used for immediate fault detection and lifetime prediction. While selecting the right diagnostic variable is crucial, advances in sensor and computing technologies have expanded the range of measurable quantities. ModemTec offers unique diagnostic system PD Doctor, which allows continuous online monitoring of partial discharges, along with environmental data.
Ultimately, combining offline and online approaches allows for a more comprehensive understanding of equipment health, ensuring timely maintenance and prolonged operational life.