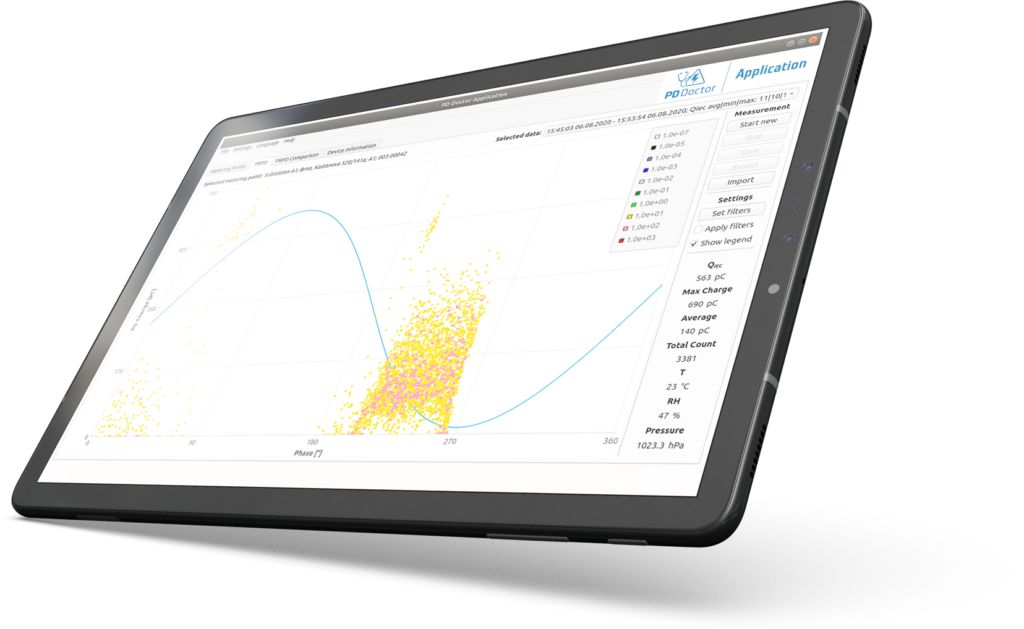
PD Doctor Application
User friendly application for partial discharge monitoring and analysis. It creates long-term measuring history for single points, matured presentation of realized measurements with possibility of summary reports creation.
PD Doctor Application
Desktop application for measuring, analyzing and monitoring partial discharges. The application communicates directly with the PD Doctor Analyzer, from which it reads the measured data. These are stored in a database under the corresponding measuring point from where they are presented in the form of diagrams and trends.
Key features:
- Remote and on-site PRPD measurements
- Detailed analysis using PRPD diagrams
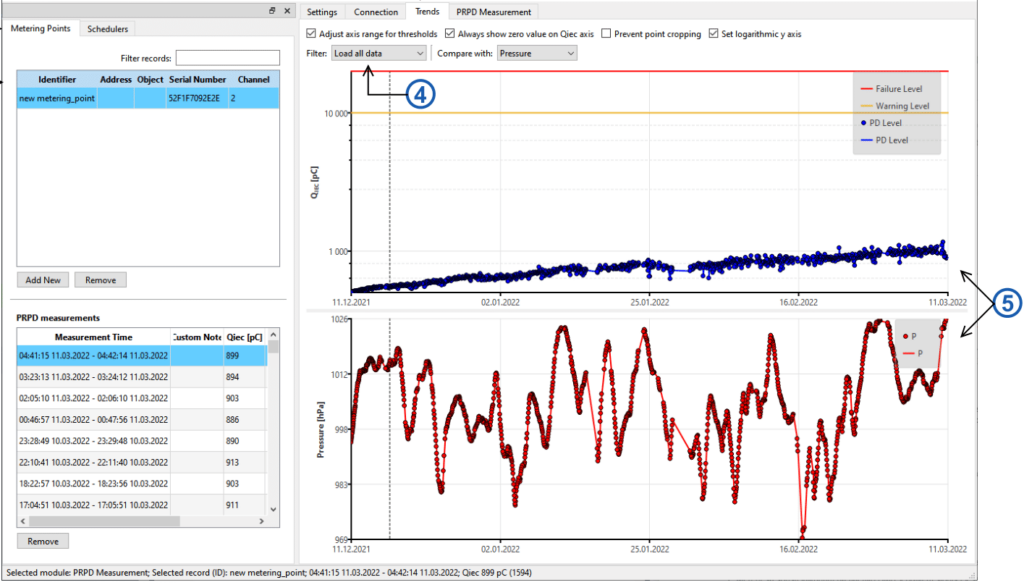
- Trends evaluation with possibility to set warning and failure levels
- Comparison of measurements
- Automatic measurements according to the scheduler
- Clear presentation of the state of partial discharges at the metering points
- Metering points management with possibility to set detailed information
- Limit alarms and notifications when PD activity reaches warning level
- Data import and export for synchronization between multiple device
- Generating reports to pdf with semaphore indication of the current PD state
Features
Measurement of partial discharges
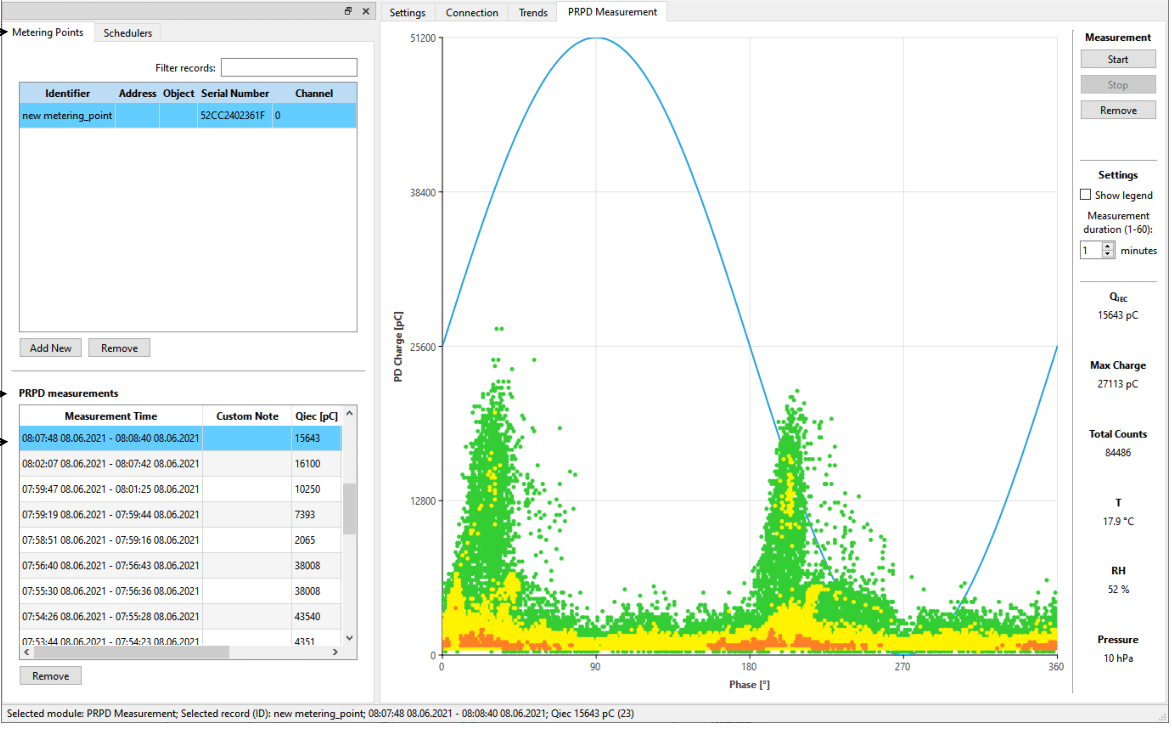
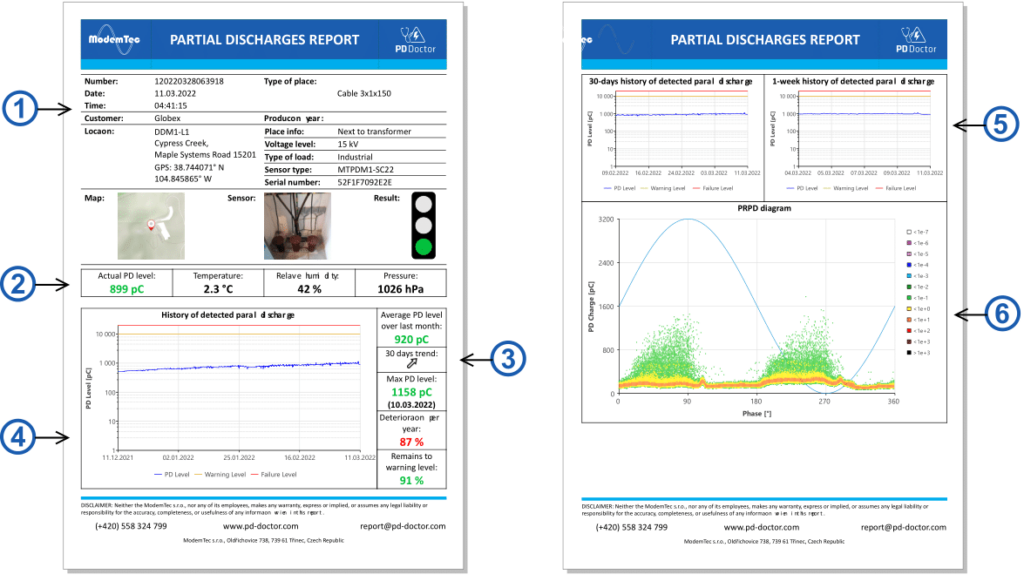
The PRPD pattern is a visual representation of partial discharge activity with respect to a 360 degree AC voltage cycle. Thus, the Y-axis represents the amplitude of each discharge, the X-axis its phase angle, and the color of the point expresses the developmental activity density for that point.
From the created pattern it is possible to deduce the type and thus the probable source of discharges. QIEC expresses the magnitude of the apparent charge, and its calculation is precisely defined in the IEC 60270 standard.
Measurement of environmental parameters
The PD Doctor system is equipped with a sensor for measuring temperature, pressure and relative humidity. PD Doctor allows you to process and visualize this information.
In the trend display mode, it is possible to compare the development trend of QIEC with the environment parameters and thus find out its possible dependence on the environment.
Manual or repetitive measurements
The PD Doctor Application allows you to perform immediate measurements at the user’s instruction according to the specified parameters. However, the measurement of partial discharges is suitable to perform for a long time and therefore the application allows you to set up a scheduler for automatic repeated measurements with preset parameters.
Parameterization and calibration of equipment
The application allows you to set some advanced functions and parameters of the analyzer device. It is also used to perform the calibration required for the accuracy of the measurement results.
Data import and export
All project data, from measuring points to individual measurements, can be exported to a file and then backed up. Backups should be performed to protect data from loss. From the backup created in this way, all data can also be subsequently imported back into the application.
Measuring point management
The measuring point represents the place where the measurement takes place and corresponds to one installed sensor. Therefore, PD Doctor includes measuring point management, which is used to create, view, edit, and delete Measuring points.
Storage of historical data
All performed measurements are stored in the database under the corresponding measuring point. In this way, the realized measurements are logically arranged and clarity is maintained even when operating multiple measured points.
Thanks to this history, it is possible to follow the trend of the development of discharge activity or to return to older measurements for the purpose of comparison with the current situation.
Display of PRPD and long-term measurement trends
The application allows the presentation of measurement results in several ways. These include the display of a PRPD diagram of individual measurements, the display of the trend of discharge activity in the long term with a comparison of the impact of the environment and a PDF report, which contains many other useful information.
Generating reports
PD Doctor allows you to generate reports in PDF format. As well as identifying the measuring point itself, these reports include historical values – overall, monthly and weekly trends.
In addition, the report is supplemented by a PRPD diagram, which can be used to analyze the current discharge activity in more detail. Additional information such as temperature, pressure and humidity define the environment during the measurement.
Recommended system requirements
| Operating system | Windows 10 |
| Processor | min. 2 GHz |
| RAM | 4 GB |
| Hard disk | 300 MB + storage for data |
| Screen resolution | min. 1024 x 768 |
| Network | LAN connection to analyzers |
Screenshots
Find out more about PD Doctor
PD Doctor Video
PD Doctor Brochure